Why a Hot Shiny Pipe Can Look Cold
A thermal camera sees surface emission and reflected surroundings together. Discover why a hot metal surface can look cool, why sensitivity cannot fix missing detail, and how to test the right thing.
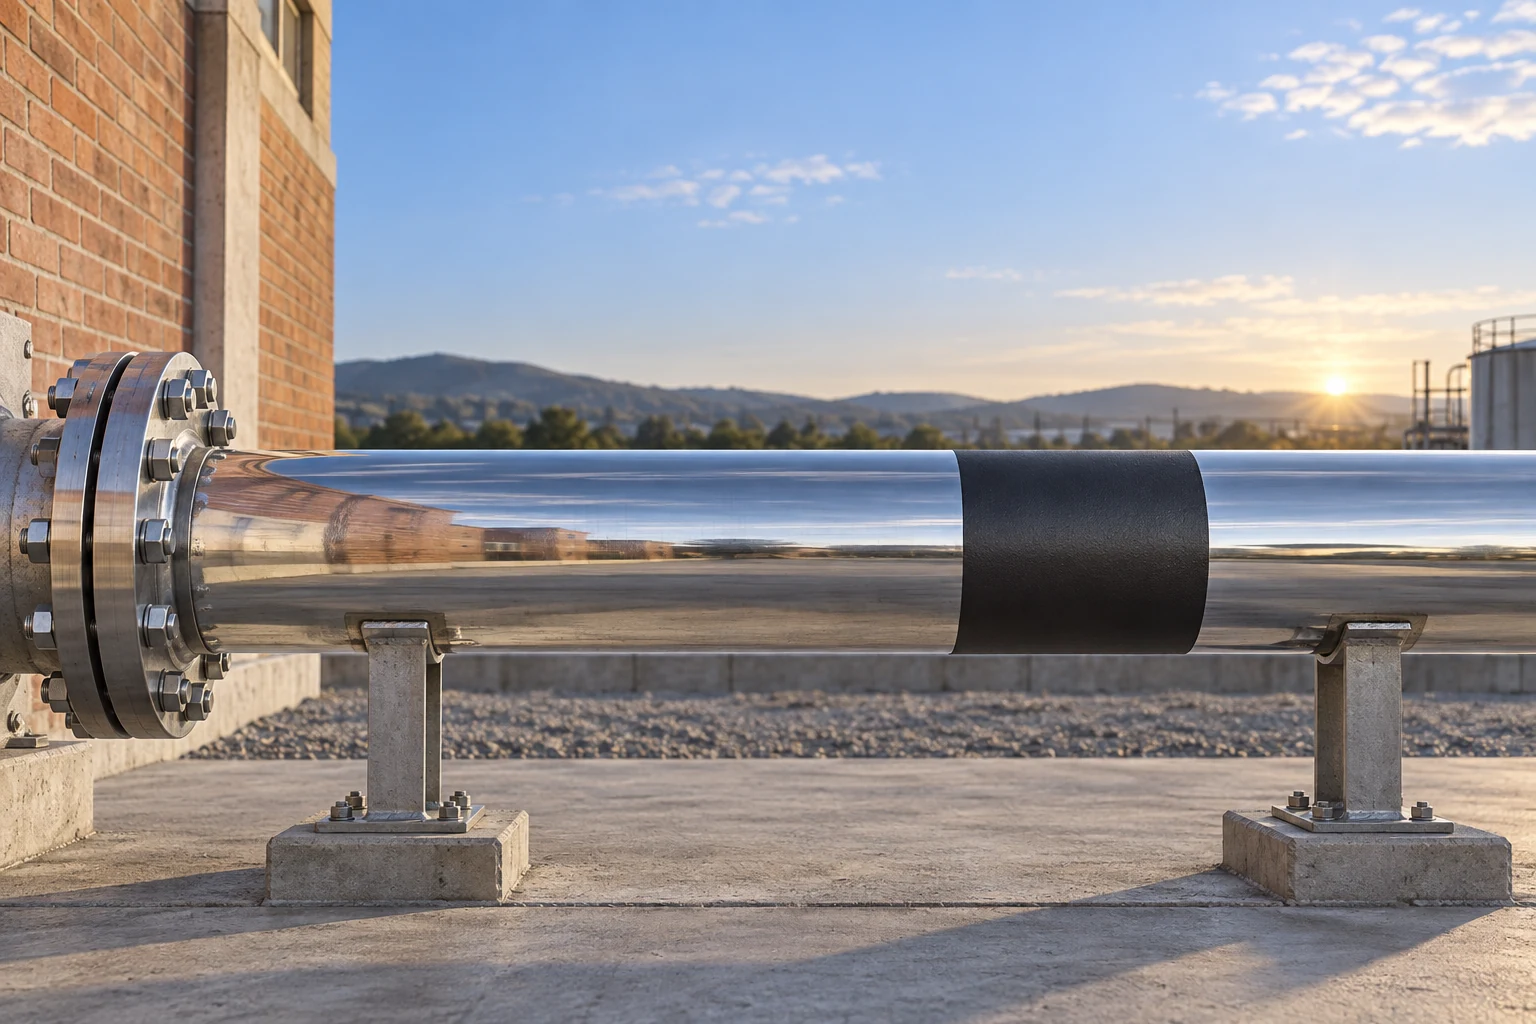
The camera may be seeing the surroundings in the metal
Imagine inspecting a hot pipe. The painted band looks warm, but the polished metal beside it looks cool. The first explanation might be a flow problem. Another possibility is much simpler: the shiny surface is reflecting cooler surroundings into the camera.
An opaque surface sends infrared radiation toward the detector in two ways. It emits radiation because of its own temperature, and it reflects radiation arriving from elsewhere. Emissivity describes how strongly that surface emits compared with an ideal blackbody at the same temperature. For an opaque surface, lower emissivity also makes reflection more important. The relationship depends on wavelength and viewing direction. Visible shine is a clue, not a measurement of emissivity in the camera’s infrared band. Radiative model for specular materials.
A thermal picture therefore maps incoming radiation, not temperature alone. A bright patch on polished metal may be a reflection of warm equipment. A darker patch may face a cooler part of the surroundings. Moving sideways can change those reflections without changing the pipe’s operating condition. This is a useful diagnostic clue, though it does not establish the true temperature.
There is a subtler trap: a scene can look reassuringly uniform when object and surroundings are at similar temperatures. Emitted and reflected contributions can then compensate for each other. A smooth image does not prove that emissivity has been handled correctly. The same study demonstrates this compensation in its numerical cases.
Keep three questions separate: What radiation leaves the surface? How much noise does the camera add? How much physical detail survives the optics? Confusing these questions can turn a convincing image into an unreliable diagnosis.
A thermal anomaly is a reason to investigate, not yet a measured temperature.
A 60°C surface can have a 24.7°C apparent temperature
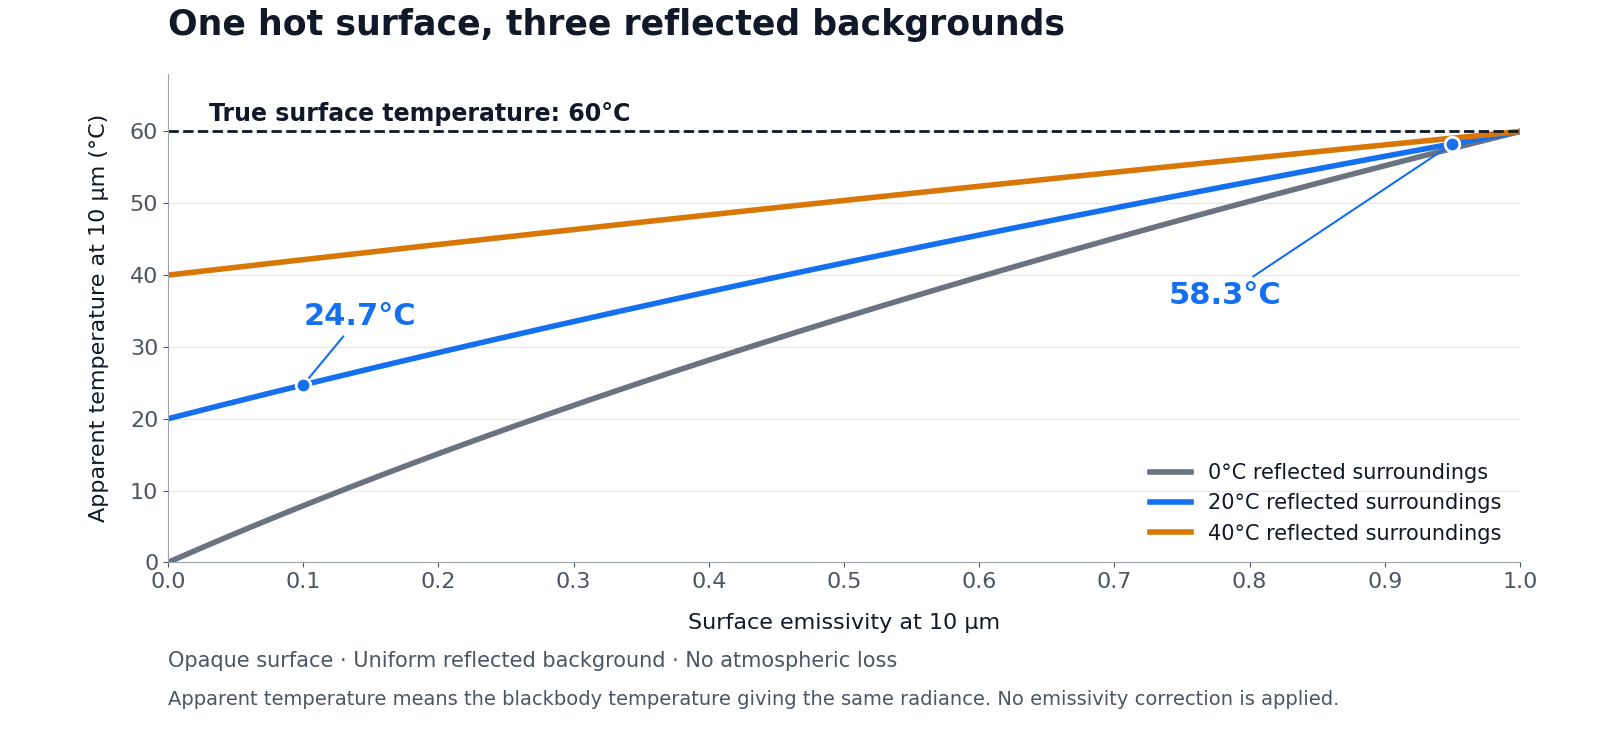
Consider a deliberately simple calculation at one wavelength: 10 micrometres. The surface is at 60°C, its emissivity is 0.10, and it reflects a uniform 20°C environment. Assume the surface is opaque and the path to the observer causes no loss.
The arriving radiance is:
L = ε × B(60°C) + (1 − ε) × B(20°C)
Here, ε is emissivity, and B is the blackbody radiance given by Planck’s law at 10 micrometres. Temperature must be converted to kelvin inside that law. Converting the mixed radiance back to a blackbody temperature gives 24.7°C. Changing only emissivity to 0.95 gives 58.3°C. These are calculations of apparent temperature before emissivity correction, not instrument readings. NIST calibration method.
Notice what the 0.10 value does not mean: the camera does not simply read ten percent of 60°C. Radiance is mixed first, then converted through a nonlinear radiation law. Averaging Celsius temperatures would give the wrong answer.
The chart also changes the reflected background. At low emissivity, the apparent temperature follows that background strongly. At emissivity 1, all curves meet at the true surface temperature because no reflected contribution remains in this model.
A real camera integrates a band of wavelengths through its optics and detector response. A curved pipe also reflects a directional, nonuniform scene. The graph explains the mechanism; it cannot supply a correction setting for a specific camera or material.
This is why adding a known reference surface can help an investigation. Its emissivity, thermal contact and temperature still need to be established. A coating is not automatically at the metal’s temperature, particularly during a transient.
Mix radiation first. Never multiply a Celsius temperature by emissivity.
A quieter camera cannot recover a feature it never sampled
Noise-equivalent temperature difference, or NETD, expresses random signal noise as an equivalent blackbody temperature change under stated conditions. Lower NETD can help reveal weak contrast. It is not a temperature-accuracy specification: a camera can produce a quiet, repeatable image of the wrong apparent temperature.
There is another reason to read the test conditions. NETD depends on how rapidly radiance changes with temperature. NASA’s MODIS research found cases where NETD increased at lower scene temperatures even though noise in detector counts remained almost unchanged. The temperature conversion changed the number. Compare sensitivity at matched conditions, not just the smallest figure on a list. MODIS noise research.
Detail has a separate geometric limit. For a flat target near the image centre, divide scene width by horizontal pixel count. With 640 pixels and a 17.7° horizontal field of view, scene width at distance R is 2R × tan(17.7° / 2). Those two values appear in the Inventra S³ thermal-imager catalogue; the distances below are planning examples.
| Distance | Approximate width per pixel | Pixels across a 10 mm feature |
|---|---|---|
| 10 m | 4.87 mm | 2.06 |
| 20 m | 9.73 mm | 1.03 |
Doubling distance halves the samples across that feature. A narrow hot spot shares its signal with the cooler background; focus and optical blur spread it further. NIST describes how blur can lower a hot area’s apparent peak while raising neighbouring values. Point-spread effects.
These sample counts are not detection guarantees or temperature-measurement spot sizes. More pixels may improve sampling, but a larger display or digital zoom cannot create scene information that was never captured.
Sensitivity helps weak contrast. Sampling and focus preserve small details.
Build a comparison that can expose the wrong answer
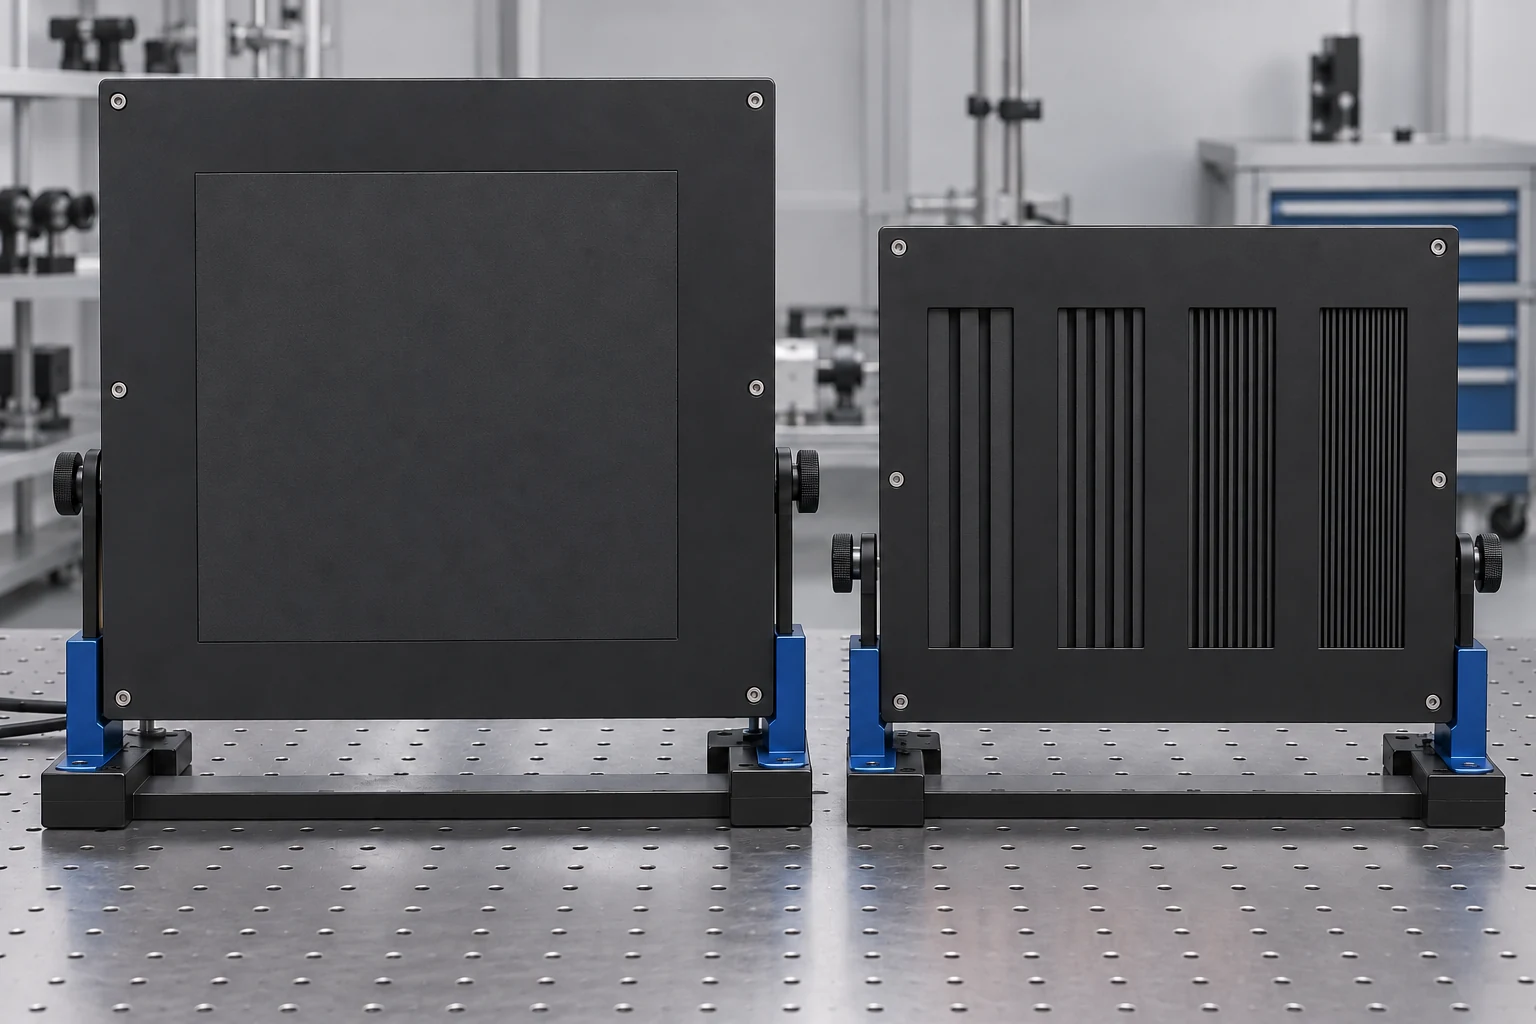
A beautiful test picture is not enough. Choose targets that can reveal different failure modes, then judge the task you actually need to perform.
Use a broad target with a small temperature difference to examine weak contrast. Keep its surface finish consistent, so an emissivity change does not masquerade as a temperature change. Record several frames to distinguish a persistent feature from flicker or drifting patterns.
Use fine bars or a sharp edge with clear contrast to examine detail. Use comparable, characterized matte coatings on foreground and background surfaces, with a known, stable temperature difference. Adjust focus on the target, keep the viewing distance fixed, and record the lens setting. Broad faint areas and fine strong patterns ask different questions; passing one does not establish the other. NIST’s image-quality work treats spatial resolution, thermal sensitivity and other factors separately, then studies their interaction in an actual recognition task. NIST image-quality study.
For shiny components, make a second observation from another angle where practical. Compare the location of the suspected anomaly against physical landmarks. If it shifts with the reflected scene, investigate reflection before interpreting it as a local thermal defect. Also hold display range and processing steady: automatic rescaling can make two captures look equally dramatic despite different signal differences.
Finally, state the output you need. Seeing an anomaly means finding a meaningful pattern. Measuring temperature requires a radiometric configuration, calibration and treatment of emissivity, reflections and the optical path. Confirm those capabilities for the exact proposed system; do not infer them from a thermal channel or its NETD value.
The useful purchasing question is therefore concrete: can this configuration reveal the smallest important feature, under the weakest relevant contrast, in the real viewing environment? That answer is more valuable than a single headline specification.
Test the physical feature and the decision, not just the appearance of the image.
Download the full article (PDF)
Related reading: Why the Strongest Infrared Band May Not Give the Clearest Image · Why a Steady Image Can Be the Blurrier One
Sources and further reading
- Active thermo-reflectometry for absolute temperature measurement by infrared thermography on specular materials
- Calibration and Measurement Procedures for a High Magnification Thermal Camera
- Noise Characterization and Performance of MODIS Thermal Emissive Bands
- Evaluation of Image Quality of Thermal Imagers Used by the Fire Service
- Thermal Imagers